How to read your pace scoreboard
Last updated: 20 August 2026
The scoreboard grades exactly one thing: are you on pace? You are on pace when what you've actually banked is no worse than 10% below the straight-line plan for today. Everything else on the page — projected finish, current daily pace, needed from here, the weekly table — exists to serve that one decision. It is computed live from your store every time the page loads, never stored and replayed.
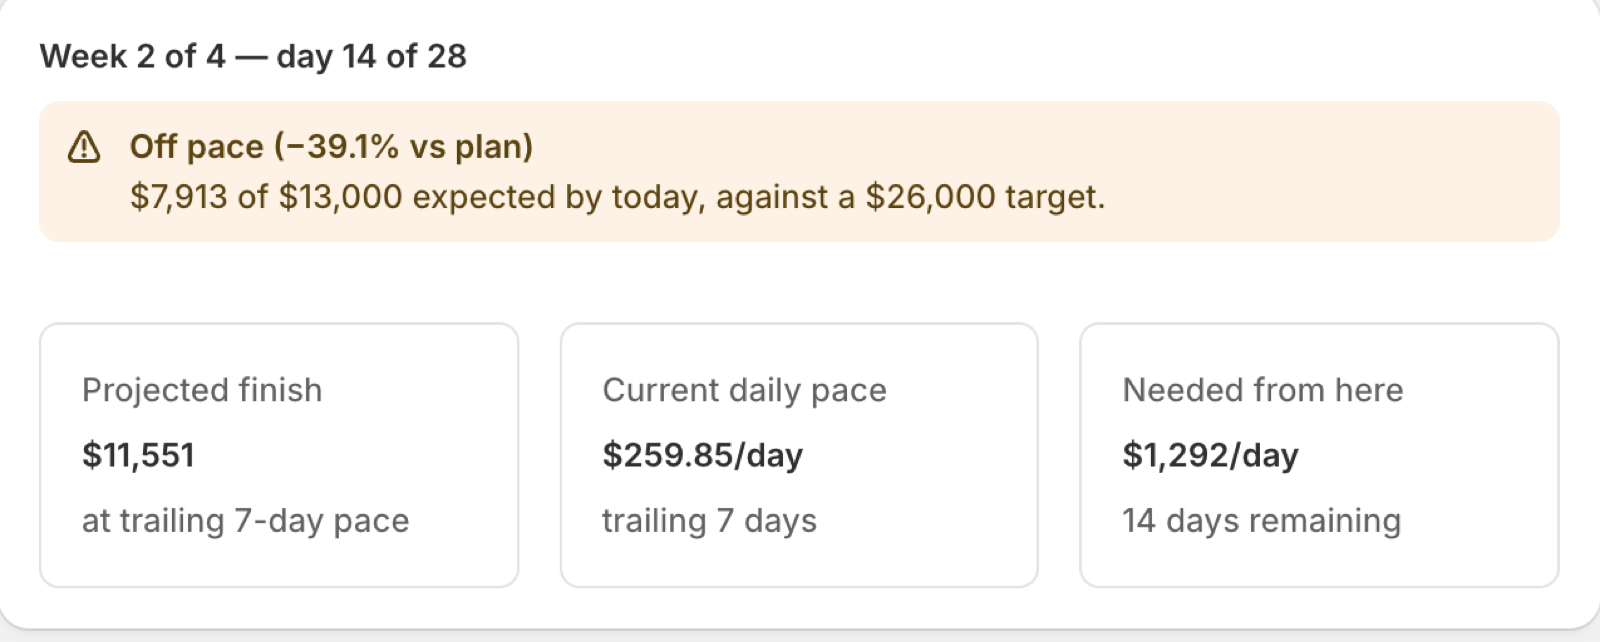
The heading and the banner
The heading tells you where you are in the cycle: "Week 2 of 4 — day 14 of 28". The banner reads either "On pace" or "Off pace", with the gap in percent, and the body puts three numbers in one sentence: "$7,913 of $13,000 expected by today, against a $26,000 target."
The middle number is the plan line: your target spread evenly across the cycle and cut off at today. Off pace is a prompt to decide something this week, not a verdict on the cycle.
The three tiles
- Projected finish — where you land if nothing changes. It is your banked total plus your current daily pace times the days left, labeled "at trailing 7-day pace" so you know its shelf life.
- Current daily pace — "trailing 7 days", not the whole cycle. Recent work is what predicts the rest of the cycle; week-1 enthusiasm shouldn't flatter week 3.
- Needed from here — the gap divided by the days remaining. In the example above, $1,292/day against a trailing pace of $259.85/day. That contrast is the honest version of "you're behind".
The daily beat
Between two weekly check-ins the pace number only drifts a few percent, so the pace hero on the app's home page adds up to three short lines that say something concrete each day:
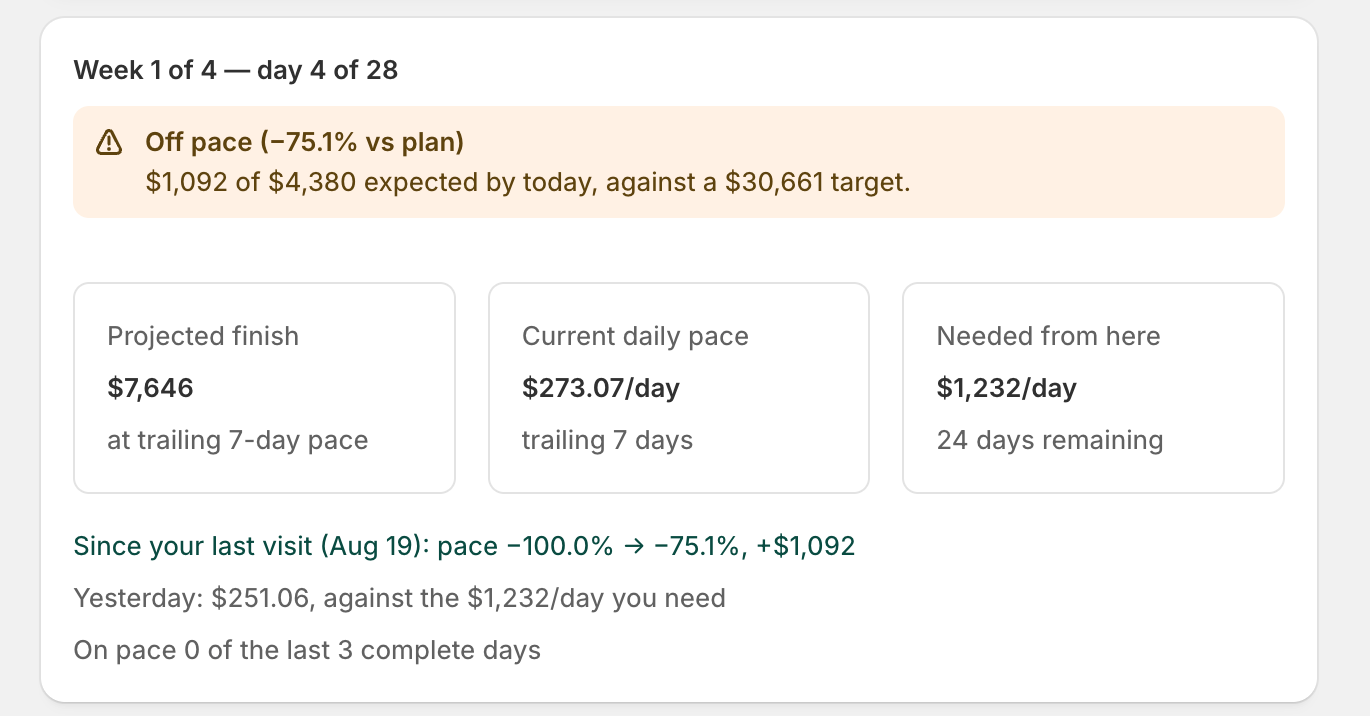
- Yesterday — "Yesterday: $251.06, against the $1,232/day you need". Yesterday means the last complete day: today's numbers are still filling in, and grading a partial day would read as "behind" every morning.
- On-pace days — "On pace 0 of the last 3 complete days". A streak, read over finished days only — and it will say zero when zero is the truth.
- Since your last visit — "Since your last visit (Aug 19): pace −100.0% → −75.1%, +$1,092". The comparison anchors to the day of your previous visit, not to earlier the same day — checking twice in one afternoon doesn't collapse the delta to zero. If the cycle, its target, or the goal's shape changed since that visit, the line stays away rather than comparing two different rulers.
All three are derived from the daily series the scoreboard already fetched — no extra queries — and a line that can't be stated honestly simply doesn't render. On a rate goal the since-visit line compares pace only, without the banked-dollars delta: two trailing levels sampled days apart come from overlapping windows, so their raw difference wouldn't mean "what moved since your last visit".
Where you stand
Three cards summarise the decision, computed from numbers already on the page — no extra queries, no second opinion.
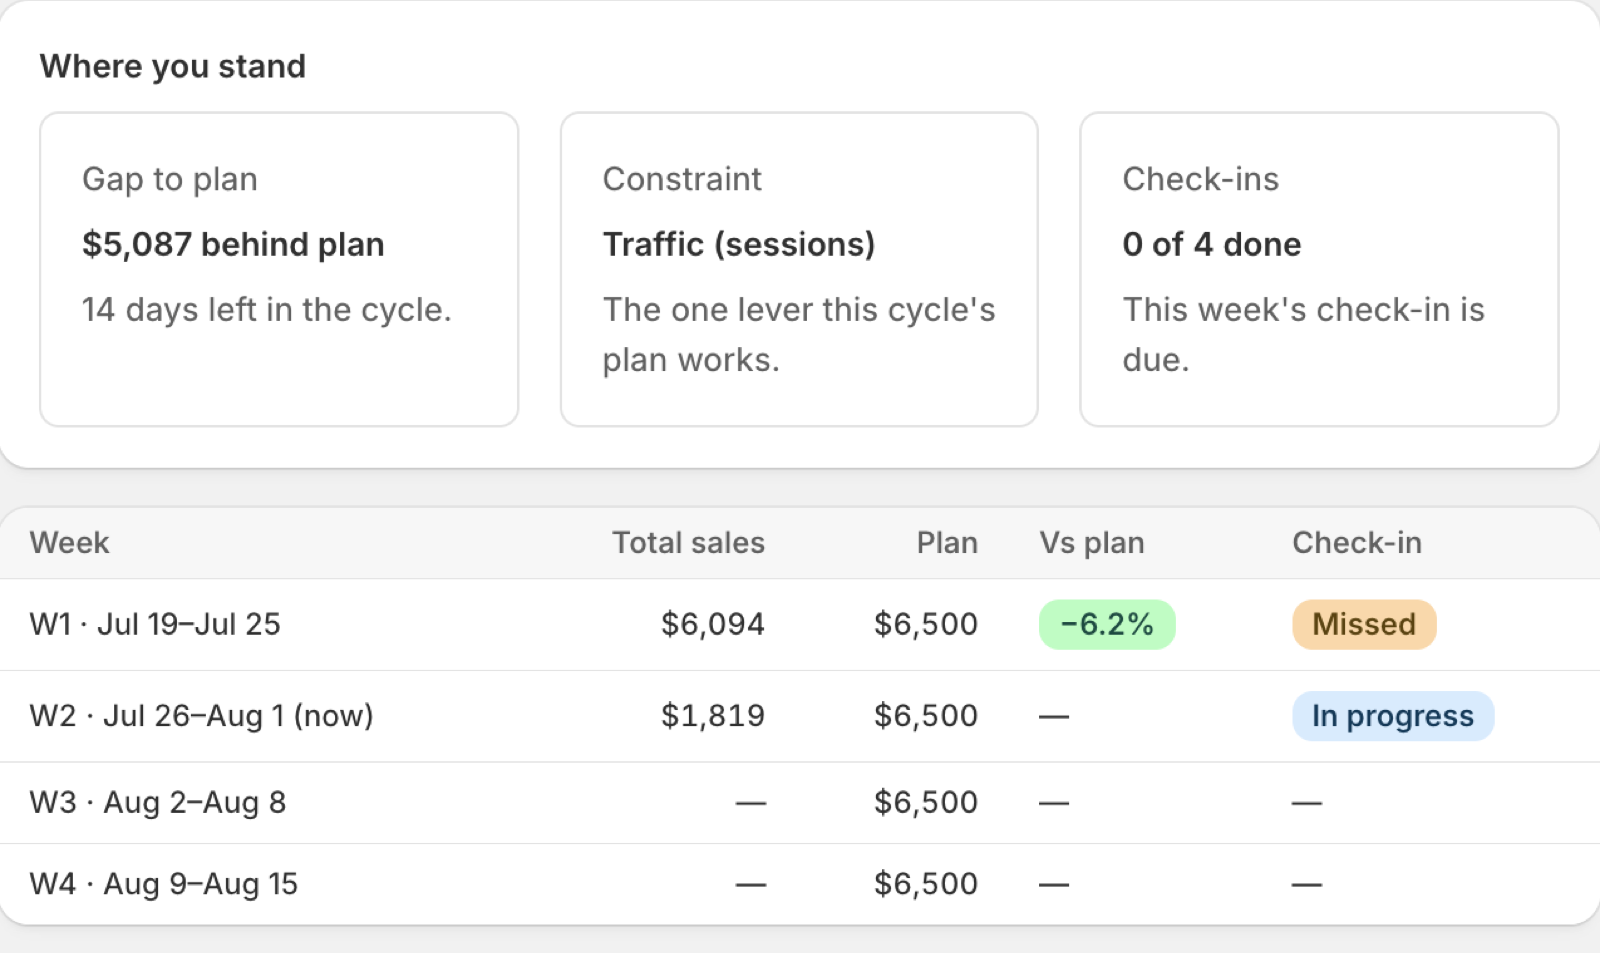
- Gap to plan — "$5,087 behind plan", with "14 days left in the cycle." under it. If the week is too thin to judge, this card says "Not enough volume" rather than printing a number it can't stand behind.
- Constraint — the one lever this cycle's plan works. If the data was too thin to name one, it says so: "No constraint diagnosed". See what your diagnosis means.
- Check-ins — "0 of 4 done", plus whether this week's is due.
The weekly table
Under the cards, one row per cycle week: the week's dates, what you actually did, the plan for that week, the gap, and whether you checked in. Past weeks carry a colour band on the gap — within 10% reads well, past 25% reads critical. The current week shows "In progress", future weeks show nothing at all rather than a zero.
The table above is worth reading closely: week 1 landed at $6,094 against a $6,500 plan — only 6.2% short — but the check-in column says "Missed". The number and the discipline are graded separately, and Paceloop won't let a good week hide a skipped check-in.
If your goal is a rate, not a total
Revenue, orders and sessions accumulate; conversion rate, average order value, returning-customer rate and margin do not. Paceloop picks the scoreboard from that shape, not from the metric's name.
A rate goal replaces the three tiles with "This week's level" (graded over the trailing 7 days), "Target level" — held every week, not reached once — "Week over week", and a guardrail tile for the metric's companion volume. The weekly table doesn't render, because there is nothing cumulative to stack.
Rate goals can miss in three separate ways, and Paceloop distinguishes them: the level is genuinely under target, the level can't be proven either way yet, or the guardrail broke. Day 0 of a rate cycle is never "on pace" — an unproven win is not a win.
The guardrail
A rate can improve for the wrong reason. If your conversion rate climbs while sessions collapse, the scoreboard says so rather than congratulating you:
"The rate improved because volume shrank, not because the funnel did — that's not a win. Rebuild [the companion metric] before claiming it."
The comparison is against the equal-length window ending the day before your cycle started, and it fires at a 10% drop. With no pre-cycle window to compare against, you get nothing — not a fabricated 0%.
What the scoreboard will never do
- Show 0% for a rate with no denominator. As the code that guards it puts it: "0% conversion" and "nobody visited" are different facts and must not collapse into the same number.
- Grade a week off a handful of events. Under about 30, the banner reads "Too little volume to grade this week honestly".
- Call a rate a win when the volume under it fell away.
If a number is missing from your scoreboard, it's because Paceloop couldn't read it — see what "Not readable" means.
Related: how to do your weekly check-in · how to close or abandon a cycle · set up Paceloop from scratch